Data is the building block for analytics, and Industrial Info Resources (IIR) has access to more data than ever before. As our coverage continues across the world, IIR's data scientists work together with our research experts to develop techniques that bring the most valuable insights with the help of visual analytics. There's no doubt we are experiencing a very dynamic, daily changing environment, and it's become more important and prevalent that business leaders have qualified answers to make strategic decisions. Data presentations are evolving rapidly, and to meet this challenge, we have begun to deploy products using common business intelligence software such as Tableau and Power BI.
This year, IIR has incorporated the use of Power BI and Tableau into our network environment so that we can create presentation dashboards for our clients that allow them to control and identify points of interest and dive deeper into finding actionable insights and data using IIR's market intelligence.
View Sample Request More InfoClick to get a tour of the Project Spending Analyzer
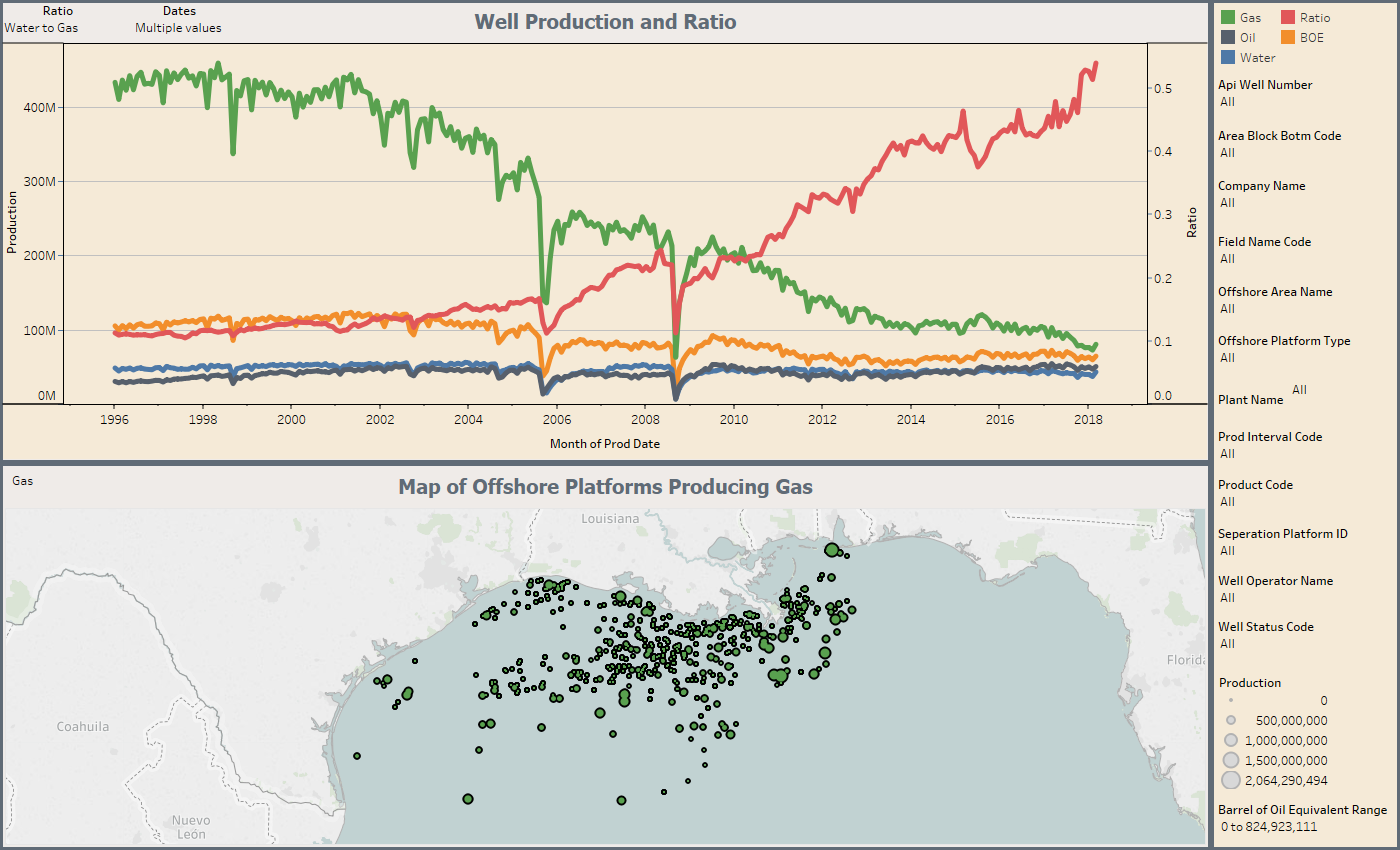
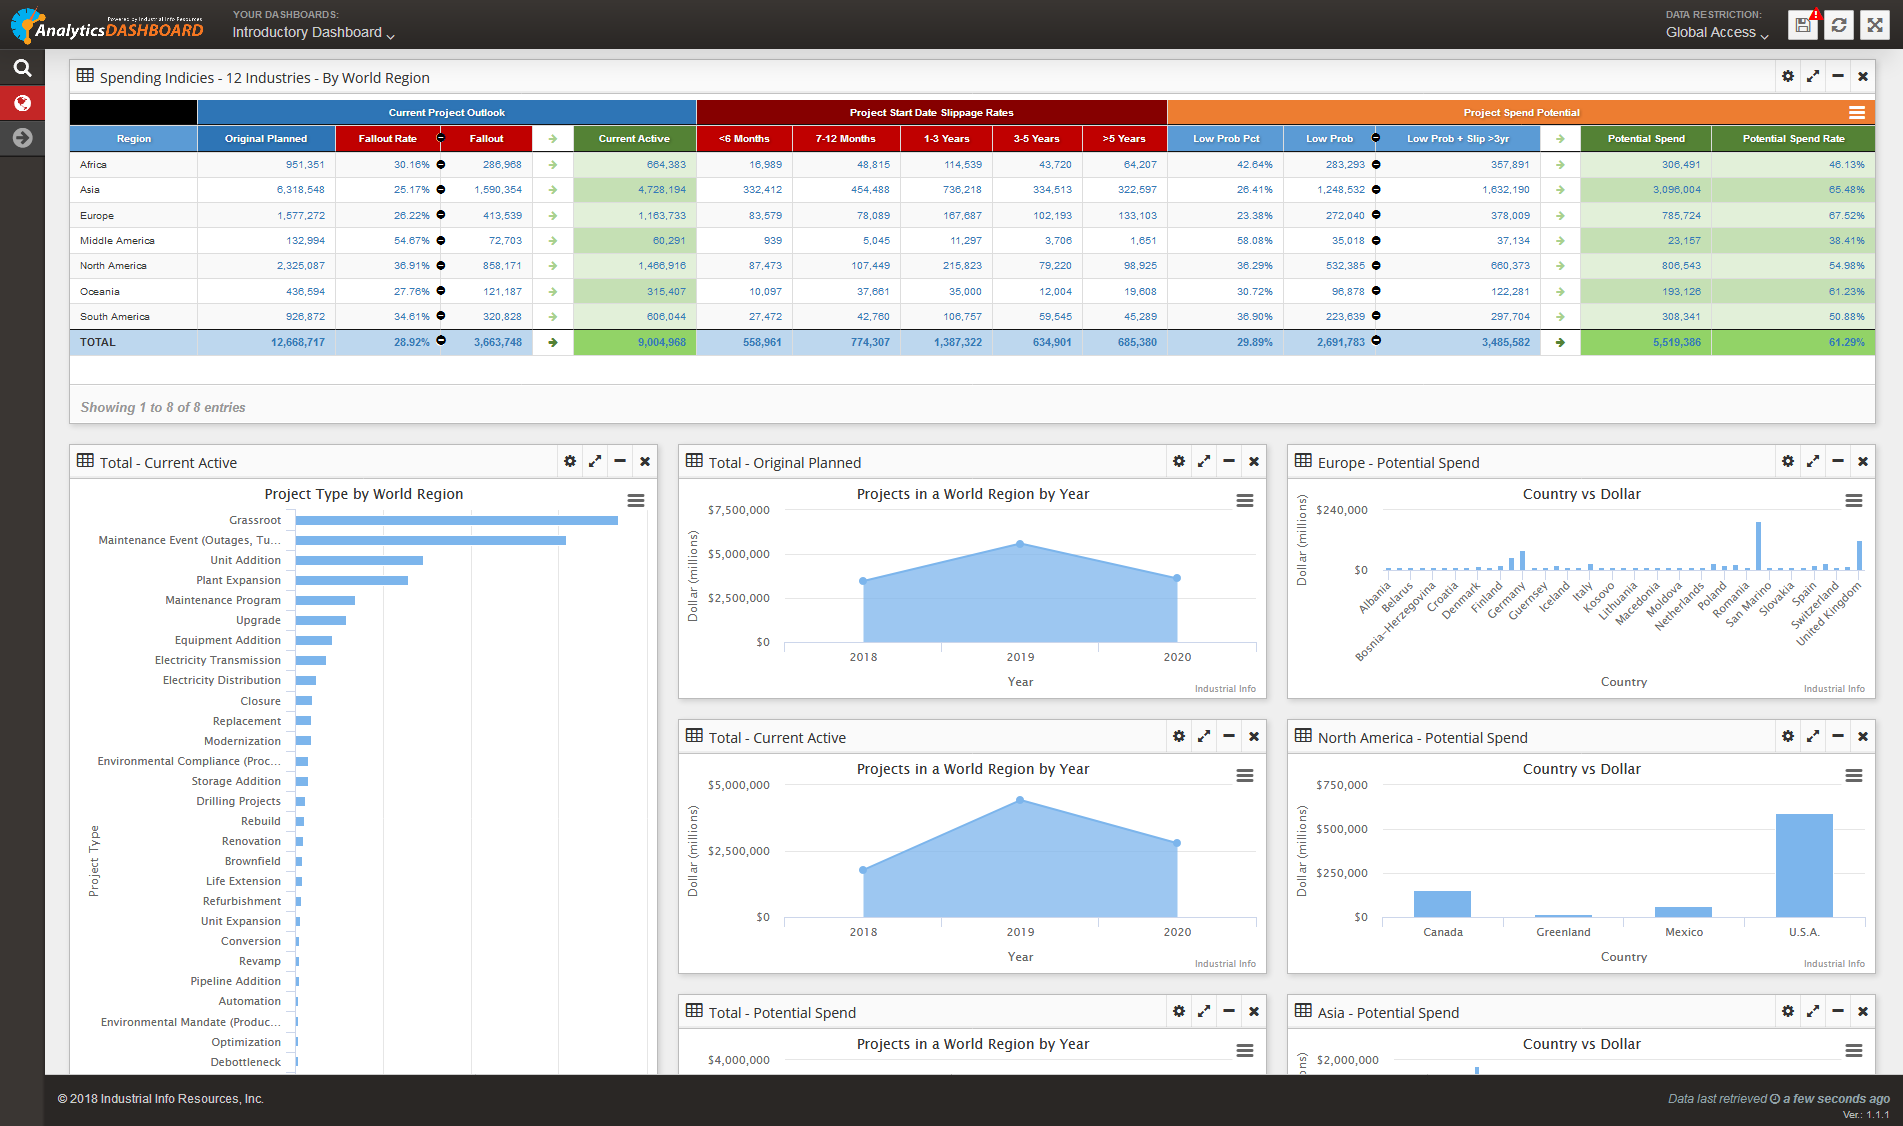
By using key metrics such as project spending indicators and indices, you will be able to identify and separate higher-risk markets from lower-risk opportunities through an interactive dashboard interface.
This feature provides the 30,000-foot view of the market for top-line analysis while allowing the capability to drill down to the 1-foot view of actionable project opportunities.
Learn MoreIIR's Analytics Dashboards are client driven and have very creative features that have been implemented in many products.
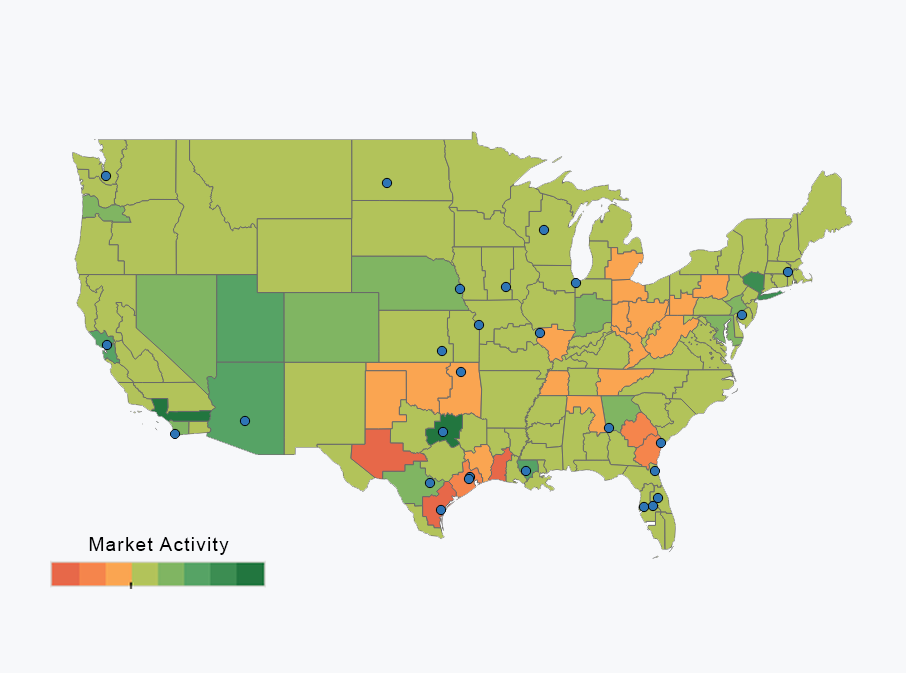
As an example, a client requested that their office locations also be layered on a map within custom market analysis that allowed for easy identification of potential opportunities near their current office locations.
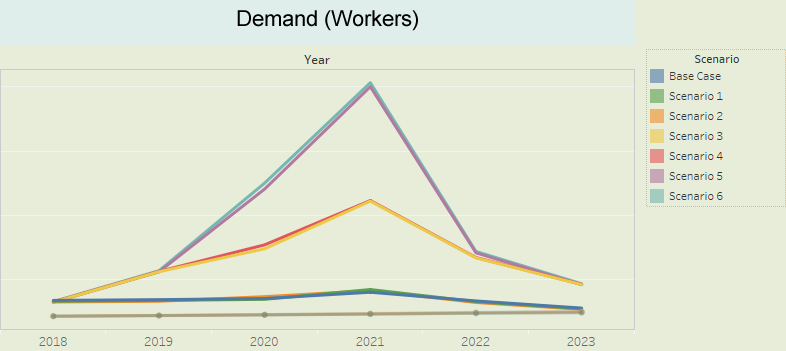
Another client requested the ability to explore wage fluctuations under various labor demand scenarios over time. Industrial Info developed a "What-If" dashboard that gave the user the option to visualize their data under different circumstances.
Manipulating data in a way that will produce an output that can be easily understood and digested by everyone can be difficult. It can also be very time-consuming to develop and launch an application that adequately meets all your requirements, especially if the data is dynamically changing or updated periodically.
IIR's Analytics Dashboards allow the user to have a new level of interactive custom analytics. IIR's interface allows you to visualize the data and analytics, and gives you the capability of adjusting the parameters to produce a multitude of different scenarios to visualize, as well as merge your own internal data.
IIR provides off-the-shelf and custom-built dashboards in Power BI and Tableau that grant users access to the analyzed data and to be in control of what is being shown, compared, or calculated.
Industrial Info Resources keeps an open line of communication and utilizes client feedback to improve the user experience for all tools. The goal of implementing Tableau dashboards is to give users the ability to explore situations specific to your unique industry, region, or case scenario.
For more information on how Industrial Info's analytics team can create an Analytics Dashboard for your specific needs, contact our Member Services Department at +1 800 762 3361.
Site-wide Scheduled Maintenance for April 12, 2025, between 9 A.M. - 9 P.M. CST. During this time, all services will be unavailable periodically throughout the scheduled maintenance window.
×For More Info!