Market Analyzer Dashboard
Link and navigate from the 30,000ft topline view of a market into the underlying actionable data
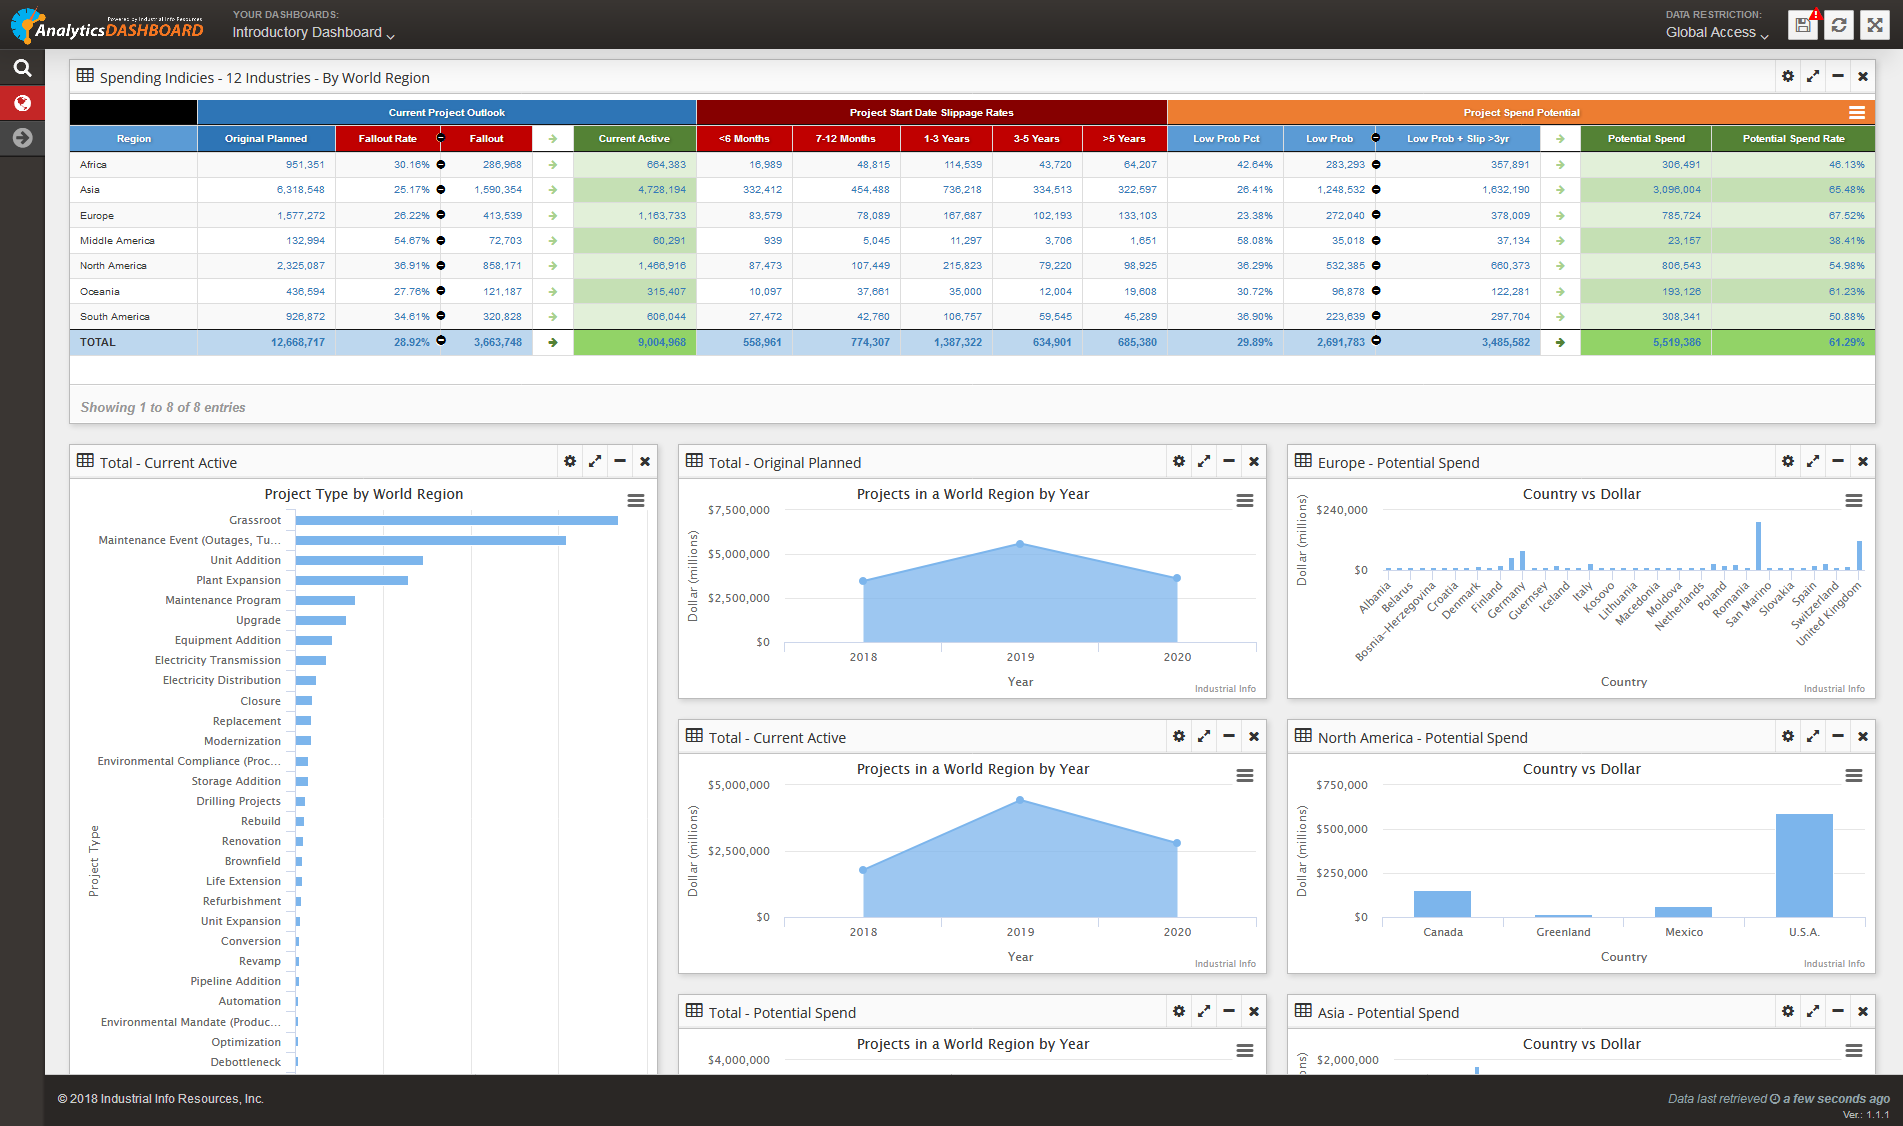
The GMI Market Analyzer enables end-users to analyze the current pipeline of planned project activity being tracked and monitored against a range of spending indicators and indices. This provides a powerful visualization and comparison of planned capital and maintenance spending across single or multiple markets and industries to help identify high growth project markets. The dashboard is dynamic, providing the ability to drill down into individual project reports making up the topline spending numbers.
Market Analyzer is available for both existing project tracking database subscribers and non-subscribers although access to the underlying individual project reports is limited to subscribers and to the scope of their data coverage within their data subscription.
Key Features:
- Multiple project spending indices including, Total Active Spend, Fallout Rates, Start Date Slippage, Probability Factors and Probable Spend
- Ability to create multiple segmentations by Industry & Sector, Geography, Fuel Type, Kick-off Dates and Project Type
- Dynamic charting
- Drill down into individual project reports contained within the project tracking database
If you have any questions, please reach out to our Member Services team at +1 (800) 762-3361.

Click to preview dashboard view